


Can Skilled Active Fund Managers Consistently Beat the Market?
- Sanzhi Kobzhan

- Jul 24
- 8 min read

It’s a common belief that with enough skill, active fund managers can consistently outperform the stock market. After all, professional money managers have vast resources and expertise, so one might assume they have a magic touch for picking winning investments. However, the data paints a very sobering picture for active management. Over extended periods, the vast majority of mutual funds (and even hedge funds) lag behind their benchmark indices. In this article, we explore comprehensive research findings (largely from S&P’s SPIVA scorecards) that debunk the notion that one can easily “pick a winning fund” or that professional traders can routinely beat the market. Finally, we discuss how individual investors might gain an edge – including leveraging a modern stock analysis app – to improve their own odds of success.
The Sobering Performance Data on Active Funds vs. the Market
Decades of data show that most actively managed funds fail to beat simple index benchmarks, especially over long timeframes. According to the S&P Dow Jones Indices SPIVA Scorecard, over the 20-year period from 2005–2024, a whopping 94.1% of all U.S. domestic stock funds underperformed the broad market (S&P Composite 1500 index). In other words, fewer than 6% managed to beat the market over two decades. Even the “best” category of funds – large-cap value stock funds – had 87.8% of managers fail to outperform their benchmark. In fact, out of 18 different U.S. stock fund categories (covering large/mid/small and value/growth styles), only two categories saw less than 90% of funds underperform their respective index. The clear takeaway is that beating the market is extremely tough in the long run for active managers.
To illustrate just how rare outperformance is, consider some additional examples from the data. On a risk-adjusted basis (accounting for volatility), 97.3% of domestic equity funds lagged the market index over 2005–2024. And survivorship bias is a factor too – less than half (only 48.5%) of the funds even survived for the full 20-year period (many laggards closed or merged). The pattern holds across categories and regions. For instance, 95.4% of emerging market stock funds underperformed their benchmark over 20 years, and even in supposedly less efficient markets like small-cap stocks, the majority of active funds fell short. Internationally, 92.5% of global equity funds underperformed the global index over a 15-year period, and 88.3% of international (ex-US) funds trailed their benchmark. The grim statistics aren’t limited to equities either – in the fixed-income realm, between 79% and 96% of bond funds (depending on category) underperformed their bond market benchmarks over 20-year spans. In one category (U.S. loan participation funds), a full 100% of funds failed to beat their benchmark over 15 years. Table 1 below summarizes some of these findings:
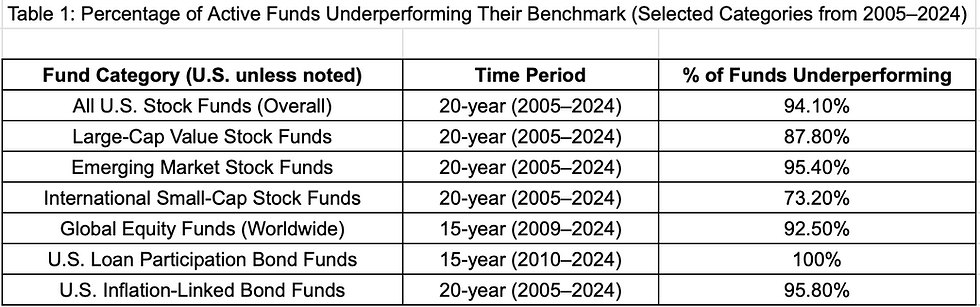
Source: S&P Dow Jones Indices SPIVA Scorecards (Year-End 2024 data). Figures represent the percentage of actively managed funds in each category that failed to outperform their respective benchmark index.
As shown above, the odds of picking an active fund that beats its index over the long haul are dismal. And even when a fund does outperform in one period, that success is rarely persistent. According to S&P’s Persistence Scorecard, very few funds remain consistent winners. In fact, the persistence of top-quartile performance was worse than random chance – implying that a fund that was top-ranked in a prior period is no more likely (actually less likely) than any random fund to stay on top in subsequent periods. This suggests that much of the outperformance we do see is due to luck rather than skill, and past success is a poor predictor of future results. In short, even skilled managers have a hard time repeating their wins consistently over time.
The story is similar for hedge funds and other professional investors. Many hedge funds also struggle to beat simple index investing once you factor in their high fees. A famous example is Warren Buffett’s bet against hedge funds: over the 10-year period from 2008–2017, a low-cost S&P 500 index fund delivered 7.1% annual returns, while a portfolio of elite hedge funds earned only 2.2% per year after fees. Despite sophisticated strategies and hefty fees, the hedge funds massively underperformed the plain index fund. This outcome underscores how even well-resourced professional managers often fail to outperform the basic market benchmark over the long run.
All this evidence debunks the notion that “skilled active fund managers can consistently beat the market.” Yes, a tiny minority of managers may outperform for some time, but identifying them in advance is nearly impossible – and very few maintain that edge indefinitely. As one analyst put it, active management’s chronic underperformance is not a temporary fluke but a structural reality. Competitive markets, high fees, and the erasure of easy opportunities mean that the odds are heavily stacked against beating the market for most players. For the average investor, the prudent strategy has long been to use low-cost index funds or ETFs to match the market rather than trying to beat it. However, that hasn’t stopped people from wondering – is there any way to gain an edge and do better?
Find Winning Stocks with the Stocks 2 Buy App for iPhone
While the data above suggests consistent outperformance is very rare, it doesn’t mean investors are completely without hope. With the right tools and strategies, individual traders can still try to beat the market (or at least improve upon average fund results). One example is leveraging modern technology for smarter stock selection and timing. Stocks 2 Buy is an iPhone app designed to help investors find strong stock ideas and identify the best time to trade them. In essence, it serves as a powerful stock analysis app that provides a suite of intelligent tools analyzing stocks from multiple angles – fundamental, technical, and even sentiment – all in real time. Below, we break down its key features and how they can potentially give you an edge:
Stock Type Screen – Know What Kind of Stock You’re Dealing With
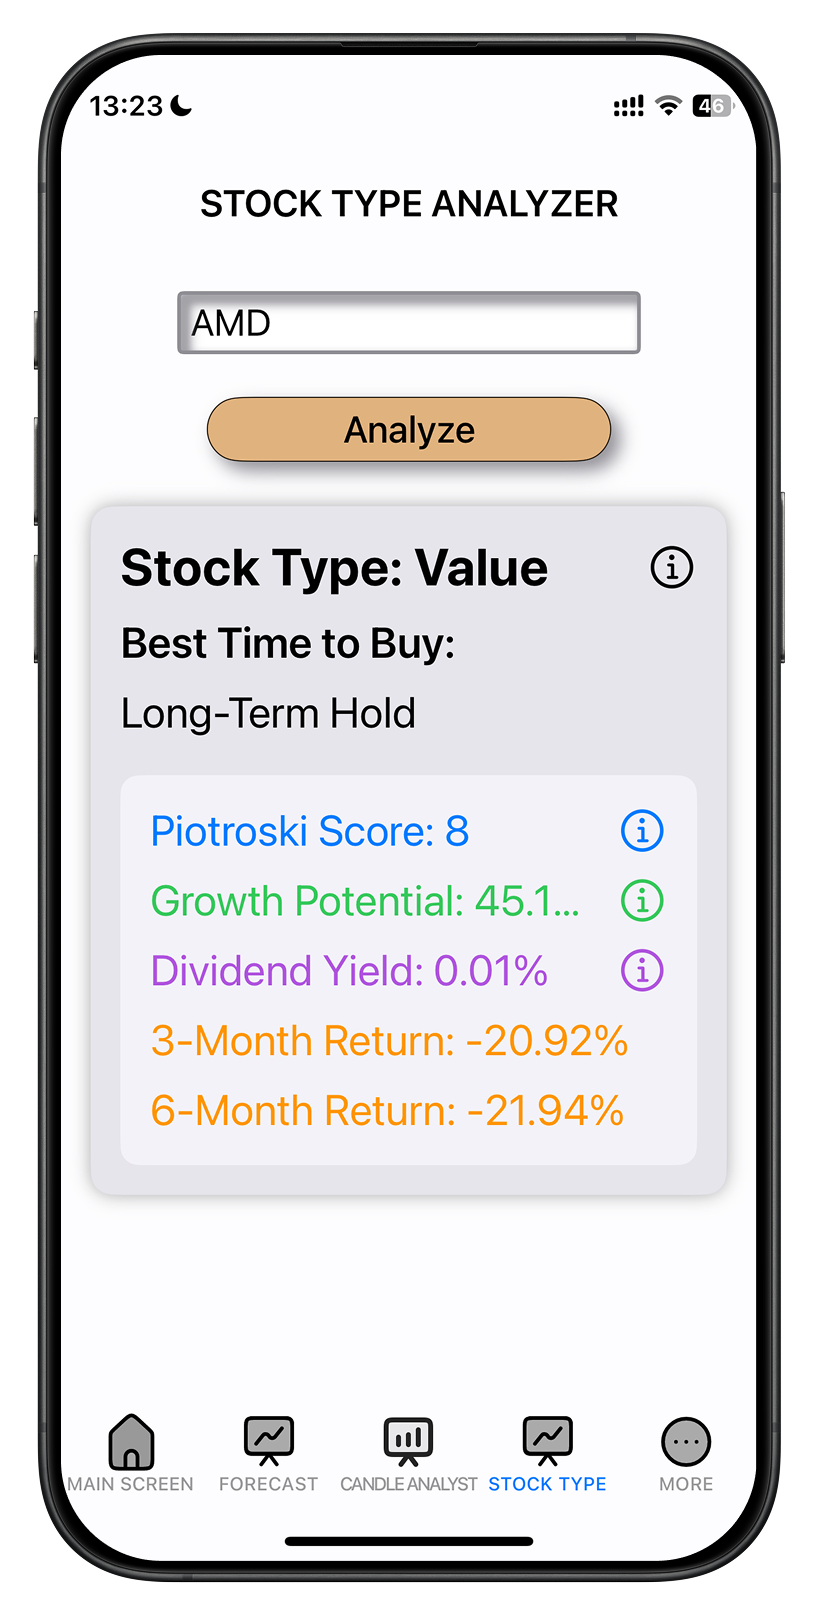
The Stock Type Screen classifies each stock at a glance as a value, growth, or income type, helping you understand the stock’s fundamental profile immediately. It provides crucial fundamental indicators: for example, it shows the company’s Piotroski F-score (a measure of financial strength and quality) and an estimated growth potential based on a Discounted Cash Flow (DCF) model. If you’re an income investor, you’ll also see the dividend yield prominently. Additionally, the screen displays recent return trends, giving a sense of the stock’s momentum. By synthesizing these indicators, the Stock Type Screen essentially tells you what kind of stock you’re looking at and whether it’s fundamentally strong. It even suggests when it might be a good time to buy. For instance, if a high-quality value stock’s recent returns are down and it appears undervalued relative to fundamentals, that could signal a buying opportunity. This feature helps you decide if a stock fits your strategy (e.g. a classic undervalued value play vs. a high-growth bet) and whether its current price looks attractive given its underlying quality and prospects.
Candle Analyst Screen – Real-Time Candlestick Pattern Insights

For more active traders, the Candle Analyst Screen acts like a personal technical analyst in your pocket. This tool continuously analyzes the stock’s intraday price action using Japanese candlestick patterns, updating every 5 minutes throughout the trading day. It automatically detects classic candlestick signals – for example, patterns like a Bearish Engulfing, Shooting Star, or Hammer – on the stock’s chart. The app then interprets these patterns to indicate the likely short-term trend direction. In practice, if a bearish reversal pattern is identified, the Candle Analyst might display a red indicator suggesting the short-term trend is turning negative. Conversely, spotting a bullish pattern would yield a green signal for a positive short-term outlook. This feature condenses complex chart information into a simple visual cue (up or down), essentially translating candlestick analysis into plain-English signals in real time. It helps you quickly answer, “What’s the market’s mood for this stock right now?” without having to stare at charts all day. By leveraging time-tested candlestick insights – which many day traders use to predict immediate price moves – the Candle Analyst Screen can give you a short-term trading edge and improve your timing on entries and exits.
Main Screen – Integrated “Buy/Sell/Hold” Signals at a Glance

The app’s Main Screen provides a clear mid-term trade recommendation for each stock: a tag to “Buy”, “Sell”, or “Hold”. This single recommendation is generated by combining several key signals behind the scenes. First, it looks at EPS surprises – how the company’s recent earnings reports compare to analyst expectations. A big earnings beat (positive surprise) is a bullish indicator, whereas an earnings miss might be bearish. This factor captures fundamental momentum, as earnings that consistently exceed forecasts often drive stock gains. Next, the app incorporates an Equity Rating, which aggregates the sentiment of Wall Street analysts on the stock (essentially a consensus rating or price target outlook). If analysts collectively have turned bullish – for example, with multiple upgrades or positive revisions – the equity rating factor will tilt positive; if they’re bearish, it will tilt negative. Finally, the Main Screen folds in social sentiment by tracking investor chatter on social media and other platforms. This measures the crowd’s mood on the stock in real time. A strongly positive sentiment (e.g. a score above 0.5 on the app’s scale) can foreshadow upward momentum, while a negative sentiment (below 0.5) could signal caution. By quantifying this “hive mind” input, the app ensures that viral trends or widely shared news are factored into the recommendation. The result of these combined signals is a straightforward Buy/Sell/Hold suggestion that reflects fundamental performance, expert opinion, and real-time market buzz all at once.
Beating the Market with Better Information
By leveraging the comprehensive tools in the Stocks 2 Buy app, individual investors can make more informed decisions – the kind that many average fund managers fail to execute. The app essentially acts as an investment analyst, scanning fundamental metrics, technical charts, earnings results, and even social media so that you don’t have to. This can help level the playing field. Armed with insights on a stock’s quality, an understanding of current price patterns, and up-to-the-minute sentiment and analyst data, you can identify promising opportunities and avoid potential pitfalls. In effect, you gain a data-driven edge to time your trades better and pick stronger stocks, improving your odds of beating the market over time.
Of course, no tool can guarantee you’ll outperform the index (remember, even the pros find it hard!). But by using a powerful and free analysis app like Stocks 2 Buy, you equip yourself with the kind of rigorous multi-angle analysis that few individual traders have at their fingertips. Over the long run, making consistently smarter choices – buying quality stocks when they’re undervalued, heeding technical warning signs, riding positive earnings momentum, and so on – can compound into significantly better returns. Many high-priced mutual funds and hedge funds fail to do these things effectively, as we’ve seen from the data. As a self-directed investor, you have the advantage of agility and now the advantage of information: the right app can help you trade with the insight of a seasoned professional.
Bottom Line: Beating the market consistently is exceedingly difficult, even for skilled fund managers, and the evidence strongly favors low-cost passive investing for most people. However, if you’re determined to try and beat the odds, it’s essential to arm yourself with superior tools and analysis. The Stocks 2 Buy app for iPhone is one such tool that puts institutional-grade analysis (fundamental, technical, and sentiment) into an easy interface for everyday investors. By quantifying what drives a stock and identifying timely opportunities, it helps you make smarter investment moves. With discipline and the right information on your side, you just might outperform those underperforming funds – and achieve the elusive goal of beating the market.

Comments