

Spotting the Best Value Stocks: Your One-Page Tool for Smart Investing
- Sanzhi Kobzhan

- Sep 16
- 5 min read
Updated: Sep 20

Hunting for the best value stocks in today's market? With endless data streams, it's challenging to identify standout companies. My streamlined stock analysis app simplifies the process. Just input a stock ticker and your Financial Modeling Prep (FMP) API key, and the app pulls together essential fundamental data in moments.
You'll receive a comprehensive snapshot including a company summary, analyst target visuals, top news highlights, recent earnings and sales performance against expectations, future projections, insider transactions, revenue breakdowns, exit strategy suggestions, and growth metrics—all consolidated into a single, user-friendly interface. Get a quick look at core details and sector context.
Earnings and Sales.
Review EPS and revenue from the past three quarters alongside analyst predictions, with simple markers for beats or misses, plus upcoming estimates.

The earnings section lays out quarterly EPS and revenue next to expert forecasts, using color signals to highlight successes or shortfalls. This instant overview lets you evaluate trends swiftly. The company profile adds useful stats like capitalization and industry placement for better understanding. Monitoring earnings matters because repeated outperformance often points to solid leadership and expansion. On the flip side, consistent underperformance could signal caution. The app reveals patterns—rising or falling EPS? Sales above or below targets? It covers the most recent three periods and includes combined forecasts for the next one. This equips you to spot rising stars among the best value stocks.
Analyst Targets & Insider Moves.
A visual heatmap displays price goals from leading analysts, complete with an overall average.
Monitor buys and sells by company leaders to gauge internal sentiment.
Gaining insight into expert price outlooks and internal trading can reveal promising picks. The app features a heatmap for analyst targets, showing individual highs and lows plus the group consensus. This setup helps you read overall market mood—optimistic, pessimistic, or neutral. Adjacent to that, an insider activity graph tracks shares bought versus sold across quarters. Company insiders frequently hold privileged knowledge; significant purchases may indicate positivity, while heavy sales could warrant scrutiny. Merging these—analyst views and insider actions—provides a dual lens from professionals and executives. When targets rise and buys increase, it might flag a top contender. If targets drop amid sales, consider it a warning.
Peer Comparisons & Sector P/E.
Stack the stock's P/E ratio against industry norms and competitors.

The app directly contrasts the stock's P/E with sector benchmarks, offering a quick judgment on whether it's undervalued, overpriced, or fair. Peer listings allow seamless switches to analyze alternatives. This comparison is key for pinpointing the best value stocks: a strong performer might seem pricey until viewed against others, or an overlooked option shines through lower metrics. The tool highlights attractive opportunities by emphasizing cheaper alternatives.
Key Metrics & Financial Ratios
The app provides key metrics and financial ratios. You need to compare them to the closest peers to find the most efficient company.
Here is a breakdown of those ratios:
ROA (Return on Assets): Measures how efficiently a company uses its assets to generate profit. The higher, the better.
ROE (Return on Equity): Shows the profitability relative to shareholders’ equity, indicating how well the company uses investors’ money. The higher, the better.
ROIC (Return on Invested Capital): Assesses how effectively a company generates returns from the capital it invests in operations. The higher, the better.
Free Cash Flow (FCF): The cash left after covering operating expenses and capital expenditures, available for debt repayment, dividends, or reinvestment. The higher, the better.
EV/FCF (Enterprise Value to Free Cash Flow): A valuation multiple comparing the company’s total value to its free cash flow, useful for assessing investment attractiveness. The lower, the better but not negative.
PEG (Price/Earnings to Growth): Adjusts the P/E ratio by factoring in expected earnings growth, giving a more balanced view of valuation. The lower, the better. Less than 1 = growth companies, 1-3 larger companies with a slower forecasted growth pace. Higher than 3, the stock is significantly overvalued relative to its earnings.
Gross Profit Margin: Shows the percentage of revenue left after subtracting cost of goods sold, indicating production and pricing efficiency. Should be stable and not fluctuate by more than 3% YoY.
OCF/Sales (Operating Cash Flow to Sales): Measures how much cash a company generates from operations per unit of sales, reflecting cash conversion efficiency. The higher, the better.
Free Cash Flow Yield: Measures the cash a company generates relative to its market value. This metric indicates how much free cash flow a company produces per dollar of its market value, expressed as a percentage. It’s often used by investors to assess a company’s ability to generate cash relative to its valuation, providing insight into its financial health and attractiveness as an investment. A higher FCF yield compared to peers suggests the company generates more cash relative to its market value, indicating it may be undervalued or more efficient at producing cash.

Revenue Breakdown.
A chart illustrates key sources of income, like products or markets. A revenue pie chart details primary contributors. If one area dominates, related developments could influence stock direction.

Growth Metrics.
Track annual changes in sales, profits, EPS, liabilities, and cash flow. The growth overview shows yearly shifts in critical areas like sales, earnings, EPS, debt, and cash reserves. Steady upward trends here often mark reliable choices for the best value stocks
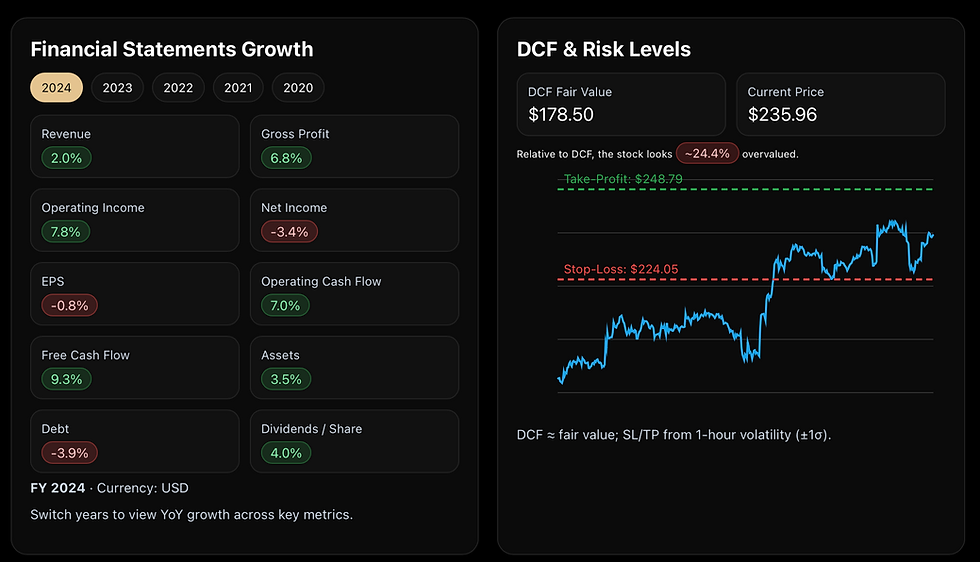
DCF Assessment and Exits.
View an estimated fair price from discounted cash flows, paired with recommended stop-loss and take-profit points. Using a discounted cash flow approach, the app estimates intrinsic value and compares it to current pricing. Visual lines indicate stop-loss for protection and take-profit for gains, based on volatility data.This risk-inclusive method stands out by offering structured exit points, reducing guesswork. Drop to stop-loss? Cut losses. Hit take-profit? Secure returns. It promotes disciplined trading for every position.Together, these features deliver a full fundamental perspective, from basics to forecasts and assessments.
Every element addresses vital investor queries: Has the stock outperformed on earnings? What's the expected price range? Are leaders accumulating shares? How does it measure up to rivals? What's its true worth, with built-in risk controls?
Comparing AAPL to SONY. For Spotting the Best Value Stock.
Use the app to compare your selected stock to its closest peers. I've decided to compare Apple to Sony Group Corporation to spot the best-value stock. Below is the breakdown of this comparison.
Metric | Apple | Sony | Takeaway |
P/E (TTM) | 32.6 | 21.9 | Sony cheaper on earnings |
EV/FCF | 37.44× | 13.18× | Sony far cheaper on cash |
FCF Yield | 2.7% | 7.6% | Sony pays you more to wait |
ROIC | 47.6% | 10.2% | Apple vastly higher quality |
Gross Margin | 46.7% | 29.4% | Apple superior margin |
PEG (TTM) | 13.51 | 30.12 | Both look pricey vs TTM growth; PEGs suggest caution |
DCF vs Price | ~24% over | ~73% under | The app favors Sony |
Analyst Targets | Avg $204.79 (below price) | Avg $111.67 (above price) | Sony has a higher growth potential based on consensus price target |
Ideally, you should go through all the peers to spot the best-value stock to invest in.
From Theory to Practice
View the demo for spotting the best value stocks.
Enhance with FMP Integration.
Tech-oriented users will appreciate the smooth link to Financial Modeling Prep APIs for real-time data pulls. Enter your FMP key to access premium, up-to-date information. Connected, it taps live feeds to surface the best value stocks efficiently, freeing you from manual calculations for sharper decisions. This tool makes core analysis quicker and more straightforward, letting you focus on strategic moves.

Comments